Researchers from Yale University have created an amphibious robot inspired by sea turtles and tortoises through a process called adaptive morphogenesis. They also gave the robot a particularly apt name, ART
Combining the best of both worlds, the robotic turtle has deformable limbs that can adjust limb shape, stiffness, and motion according to its surroundings. As the robotic turtle transitions from one environment to another, its limbs use variable stiffness materials and artificial muscles to change its shape. ART has flexible limbs:
ART’s limbs are deformable:
When the robot is placed on land, it can walk on land in various gaits
Once in the water, ART turns its legs into flippers, allowing it to swim with an aquatic gait based on lift and resistance.
Karl Ziemelis, chief physical science editor at Nature, said: “You could almost think of “adaptive morphogenesis” as a form of on-demand evolution of robots.
ART differs from other amphibious robots in that it utilizes the same components for propulsion in both aquatic and terrestrial environments, while other robots require the addition of multiple propulsion mechanisms to adapt to different environments, which in turn leads to energy low efficiency. “Our findings suggest that adaptive morphogenesis can improve the efficiency of robots moving in a variety of environments,” said corresponding author Kramer-Bottiglio.
Potential applications for this amphibious robotic turtle are many, including ecosystem monitoring along coastlines, and marine aquaculture. In addition, the robotic turtle will help researchers study the physics of motion in complex surf zones and other transitional environments.
How did the amphibious robot turtle form?
In panel a below, ART replicates the limb shape and gait of highly adapted sea turtle species and constitutes a platform for specialized movement patterns capable of transitioning between aquatic and terrestrial habitats.
Figure b is a side view of the deformed limb, the scale bar is 30 mm.
Figure c is an isometric view and a top view of the CAD model of the robotic turtle, and the scale bar is 0.16m. where θ, φ, and α denote the axes of forward and backward, upward and downward, and angle of attack motion, respectively.
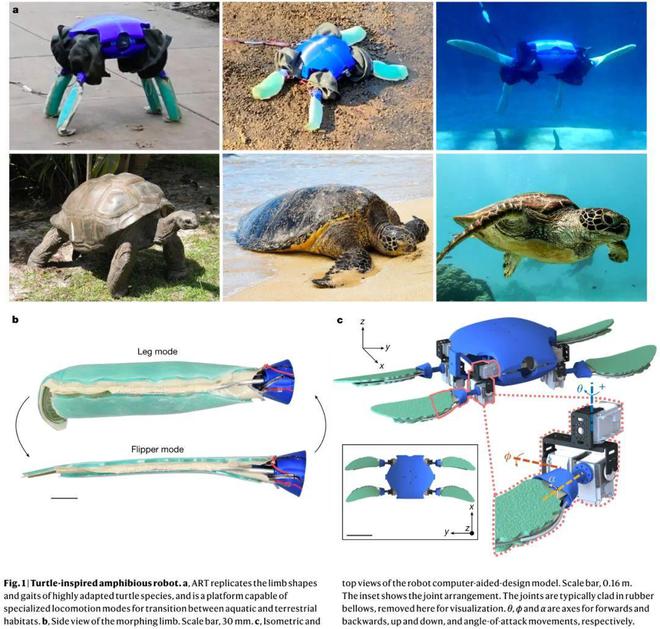
Figure 2 below shows the swimming form of ART. Figure a shows the surface and underwater swimming of the robotic turtle by adjusting the buoyancy.
Figure b shows the relationship between the angle of attack offset and the Cost of Transport (COT) of the turtle-inspired fluttering gait. Highlights of three different areas: in the left (red) area, the flapping COT is higher than swimming; in the middle (yellow) area, the COT drops in a span of 10 degrees, indicating the transition where the Turtle produces the main thrust; In the right (blue) area, COT is close to its optimum value.
Panels c and d represent the important steps of one gait cycle (top), x-gait cycle (middle), and z-gait cycle (bottom) for swimming and flapping gaits, respectively.
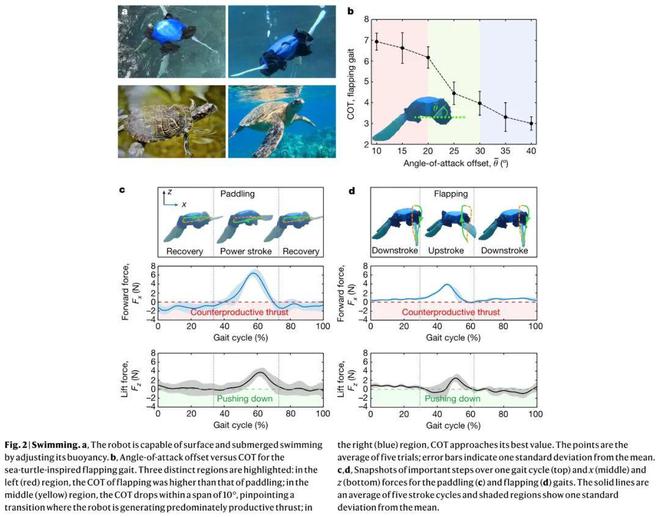
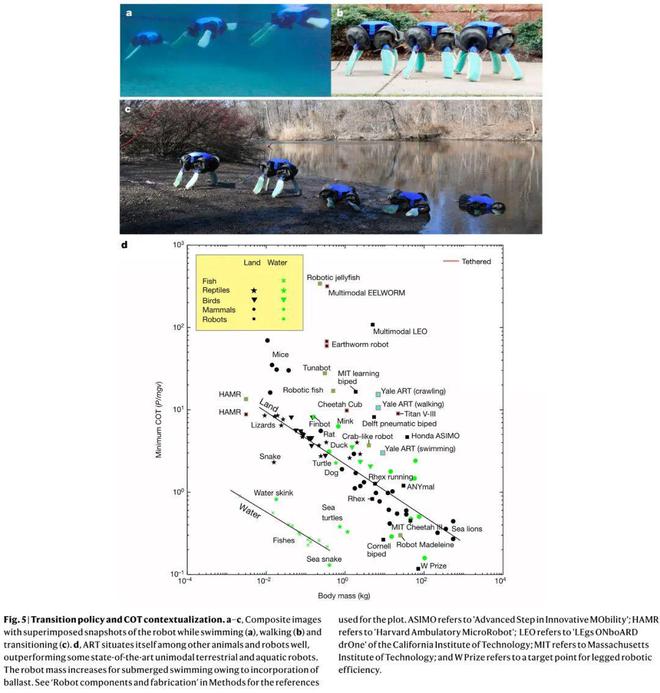


GIPHY App Key not set. Please check settings